What’s the impact of remote work on housing markets?
Part 4 of Donuts & Megaregions: the New Economic Geography of Remote Work
This is part 4 of my 4-part series on remote work and its impact on the housing market. Part 1 can be found here, part 2 here, and part 3 here.
Working from home increases the demand for, you guessed it, homes. Activities that were previously done at the office are now done at home, and this increases demand for time and space in homes. Makes sense! All things being equal, the increased demand for housing driven by remote work will push up prices, because in the short-term the supply of housing is relatively fixed.
Between 2020-2022, we had back-to-back years of 20%+ annual increases in US home prices. Bonkers stuff. How much of those price increases can we attribute to the increased demand as a result of remote work? Research out of the Federal Reserve Bank of San Francisco concluded that remote work accounted for over half of the manic growth in home values we saw over that period.
The rapidly accelerating home values we saw were not the result of a speculative bubble but largely a result of a big shift in housing demand that ran up against a supply of homes that’s relatively fixed in the short-run.
In the long run, housing supply is more responsive to changes in price (elastic). Builders will build more houses and bring more supply onto the market in response to higher prices (at least that’s how it works theory; in practice there are many barriers that prevent supply from keeping up with demand).
In addition, remote work is driving workers to lower-density areas with greater elasticity of supply (i.e., fewer barriers to new construction). If remote work is driving more population to either smaller cities or less dense areas around major metros, this would have the effect of pushing home prices lower in aggregate, because it’s easier and cheaper to build (or renovate) more housing in those markets thereby reallocating housing demand from high-price areas to low-price areas.
So remote work’s impact on housing values will be the net effect of two factors: the increased overall demand for housing from remote work (underpinning higher prices) and the shifting of that demand to areas where supply can adjust more readily (softening price pressures).
As the saying goes, predictions are hard, especially about the future. But the researchers who really study this stuff have estimated the overall net effect in the long run might be a modest reduction in housing’s contribution to measures of inflation like CPI. In other words, the long-term effect of remote work might be slightly lower home prices in aggregate.
But is there a more meaningless concept than the concept of aggregate US home values? Sure, it’s important for economists and policymakers and real estate companies if they have national scale (most of them don’t). As you may have heard before, location is something that’s pretty important when it comes to real estate. And it’s remote work’s effect of shifting population and housing demand around to different locations that has the potential to transform the economic geography of the US.
A lot of remote workers moved from big cities to smaller ones, like moving from San Francisco to Boulder, for example. Another major cohort moved further out from their existing city (like moving to the Hudson Valley from NYC). Still others moved from one big city (SF) to the outlying counties near another big city (NYC). These trends help explain why many small-to-mid-sized cities are seeing healthy population growth and why we saw a massive increase in home values in the outlying counties around major metros over the last couple of years.
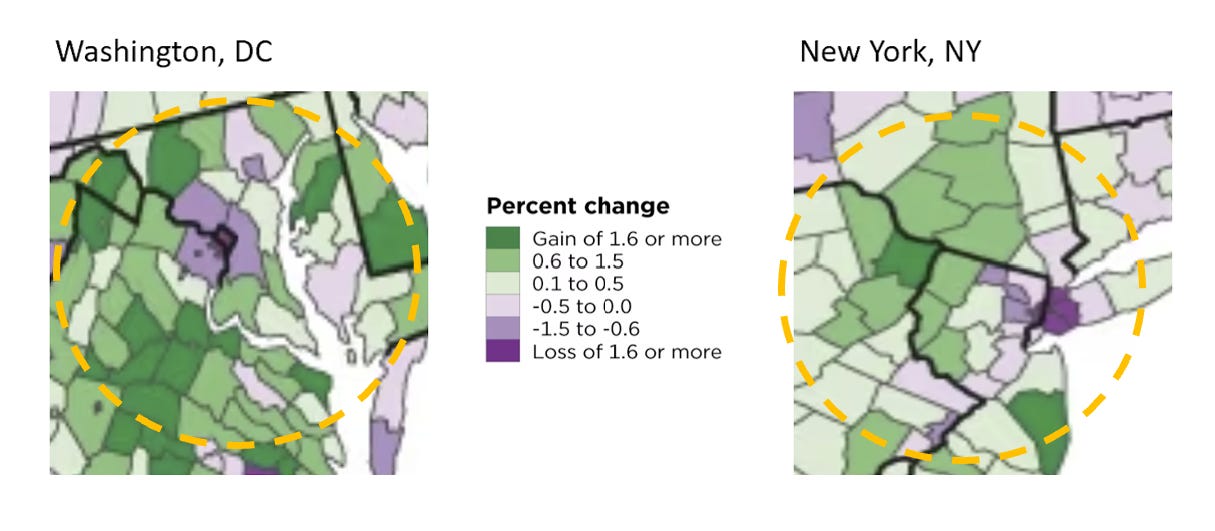
The pandemic-era trend of the urban core losing population and the outer rim of counties surrounding the urban core gaining population is called the “donut effect”, so named by Stanford researchers Arjun Ramani and Nicholas Bloom in a 2021 paper. In their analysis, they found that the urban cores of the 12 largest metro areas lost approximately 8% of their population while “low density” zip codes grew by around 1%.
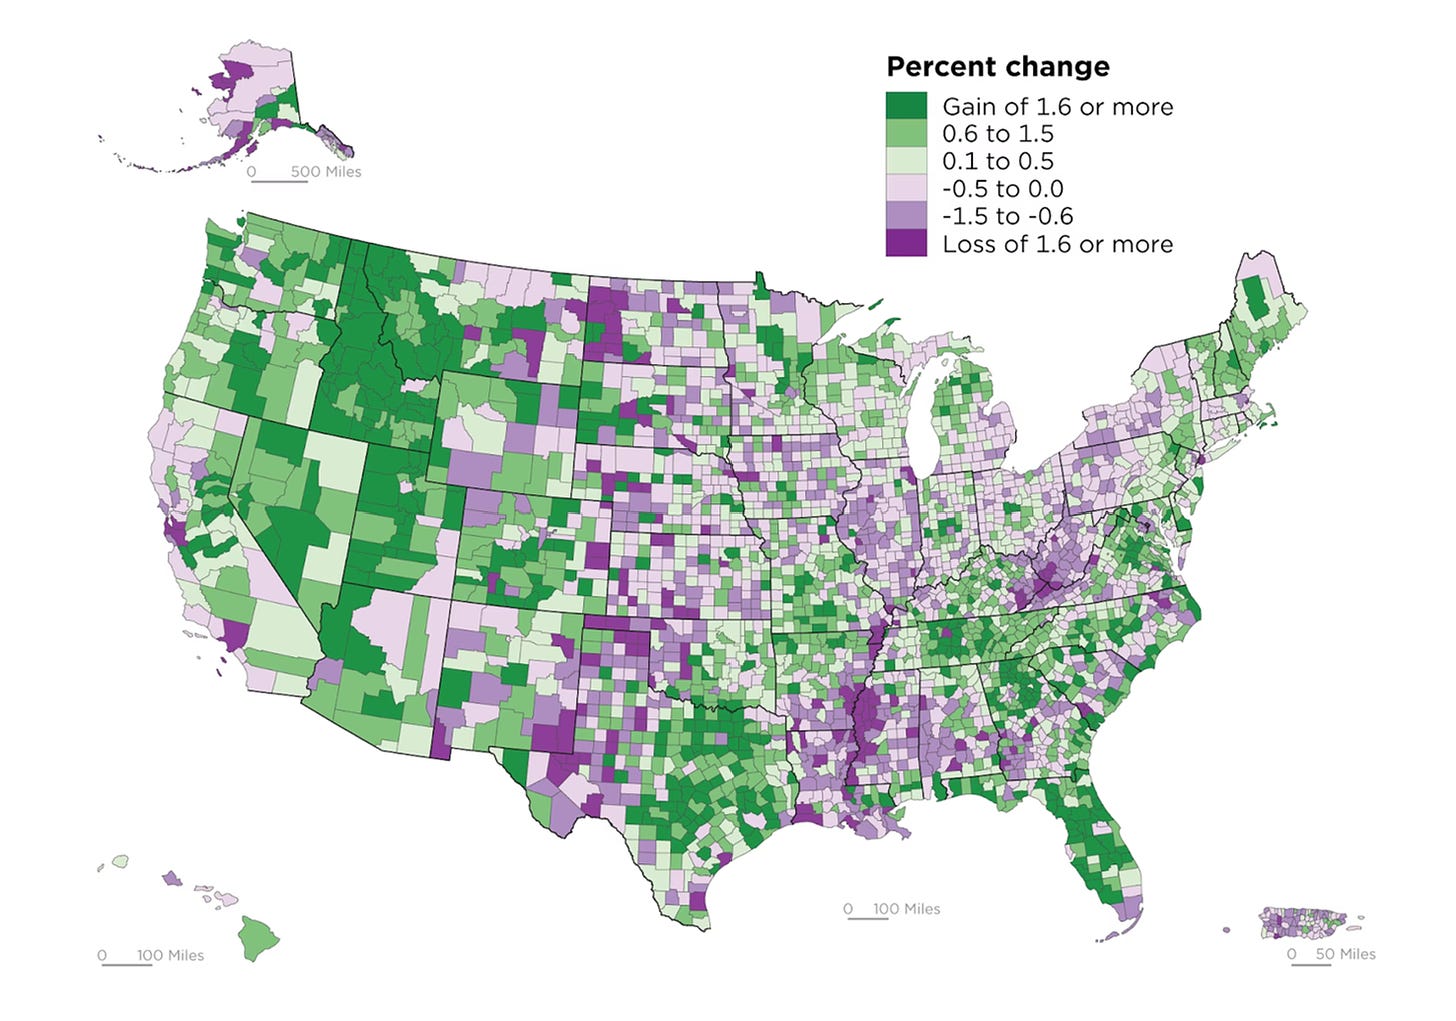
You can see the donut effect at work by examining the Census Bureau’s high-resolution map of U.S. population growth for 2020 and 2021.

Pick a major metro (DC, NYC, SF, CHI, etc.) and you’ll see population loss in the core and population growth in the perimeter, so it looks like a donut.
As a result of how remote workers will increasingly choose to live a new era of more flexible work, it’s likely that many of the markets within the donut area formed by 1-3 hour drive-time radius outside major metro areas are poised for outsized growth and development. And it’s also likely the case that many small-to-mid-sized American cities are poised for outsized growth and development.
The perimeters 1-3 hours outside of major metros are vast areas with varying degrees of amenities and overall attractiveness. The question becomes, what are the markets in those areas that are best positioned to grow in a new era of remote work.
Similarly, there are a great many small-to-mid-sized American cities out there with varying degrees of amenities and overall attractiveness. Which ones are best positioned to grow in a new era of remote work. In other words (and to beat this analogy completely to death) where are new donut holes being made?
We’re building Stuga to cut through the complexity of buying and owning homes in an era of greater flexibility but decreased affordability. We feel like we’re getting a pretty good handle on the answers to questions like these, and I look forward to sharing those answers with you as we learn them. If you’d like to explore any of them with us, or if you have your own questions, please don’t hesitate to get in touch.


