How many jobs will be done remotely?
Part 2 of Donuts & Megaregions: The New Economic Geography of Remote Work
This is Part 2 of my 4-part series on remote work and its impact on the housing market. Part 1 can be found here.
In the Summer of 2020, at the height of the pandemic, a little over 60% of paid full-time work days were worked from home. I remember seeing that number in a news article at the time and finding it astonishing.
Given the state of the world at that time, I suppose that 60% number represents something of an upper bound, in extremis, of the number of jobs that can conceivably be done remotely. We can suppose that the remaining 40% of work cannot be done in nearly any situation absent radical changes in technology (you know, things like nuclear fusion, generative AI, metaverses, etc.)
In the parlance of those pandemic days, work that could not be done remotely was deemed “essential”. Essential workers, as you may recall, included the brave soul working the checkout line at the grocery store whom you cautiously interacted with before going home to sanitize your groceries. Fond memories.
Since that time, the amount of work being done remotely, as measured by the total amount of paid work hours being done remotely, has drifted down from 60% to something that resembles a sustainable, longer-term equilibrium of around 30-35%.
This measure gives us a good sense for the total quantum of work that’s being done remotely. But it doesn’t tell us much about the mix of work that’s being done remotely. To do that we need to look at the types of jobs that can be done remotely.
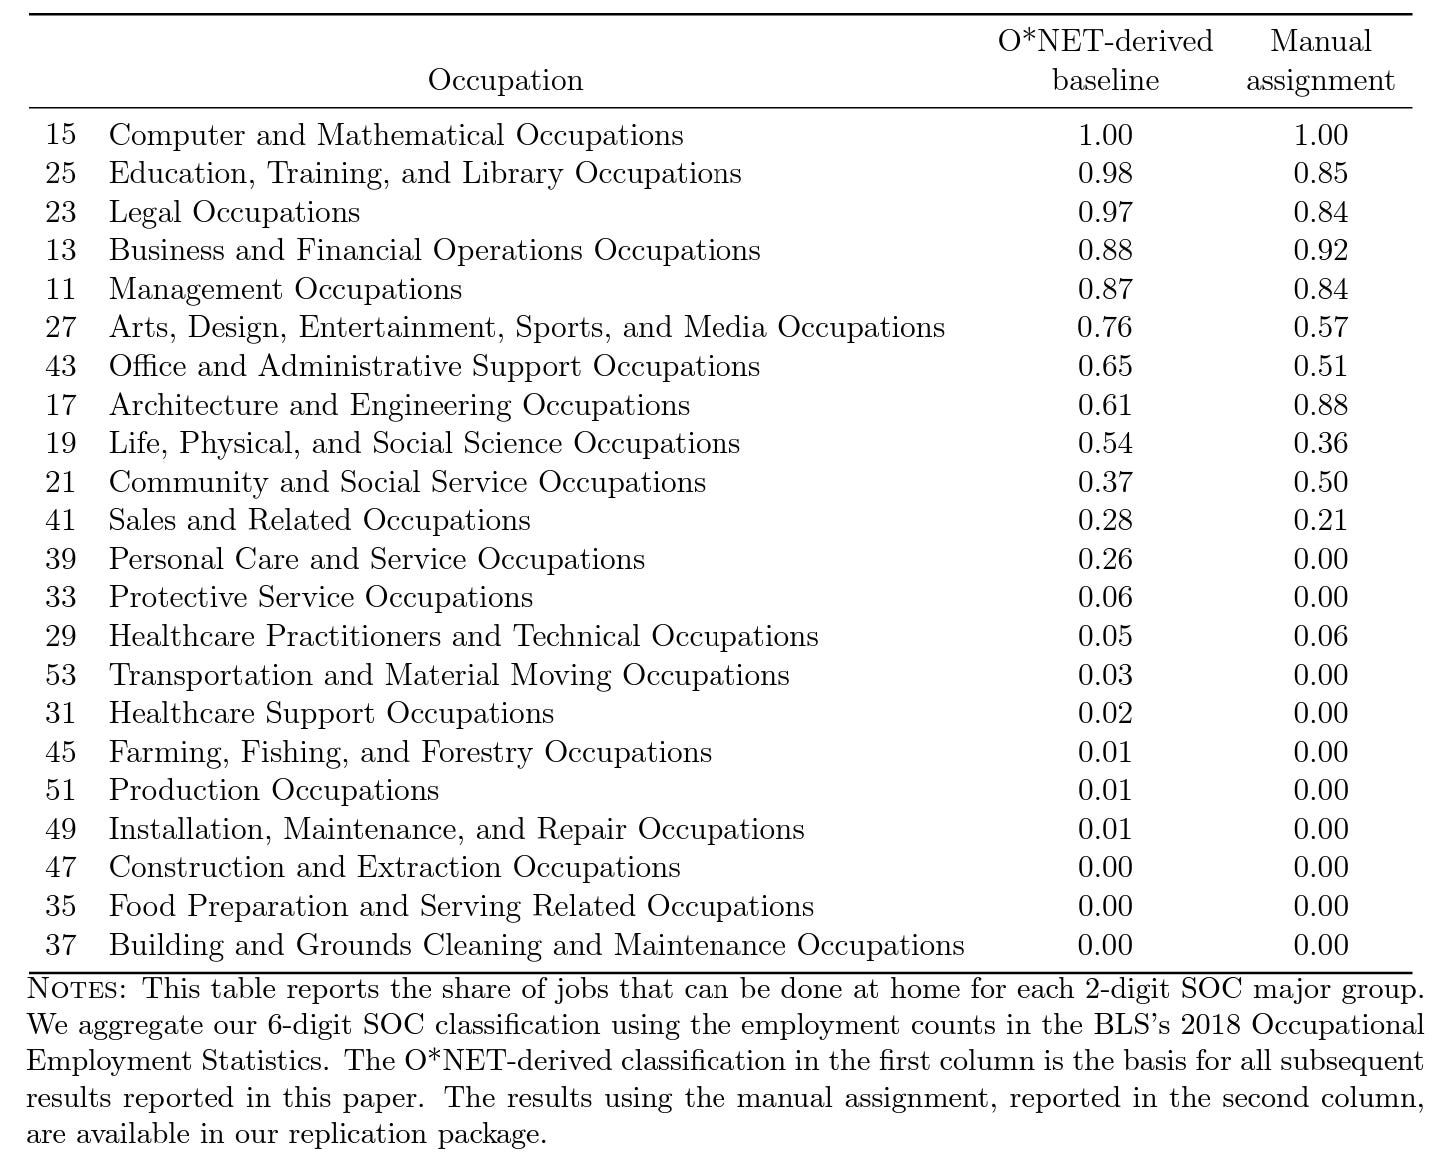
Jonathan Dingel and Brent Neiman, both at the University of Chicago, produced a frequently cited analysis of the types of jobs that can be done at home. They find that 37% of US jobs can be performed at home or fully remotely. Here’s the rank-ordered list, which looks pretty intuitive to me:
The 37% of jobs that can be done at home account for an outsized portion of US wages (46%), because on average they pay more than those that cannot. They’re also highly correlated with college education attainment.
Other researchers have looked at workers who cannot work from home and find much the same thing. They also find that people who work in jobs that cannot be done at home are more likely to rent their homes.
Interestingly, while workers who cannot work from home are more likely to be renters, places with a high share of jobs that can be done at home have lower homeownership rates despite having higher average incomes. That’s because the places with the highest proportion of jobs that can be done from home are generally major urban areas where homeownership is out of reach for even many affluent workers. Housing affordability is a policy issue that cuts across dimensions of class and geography.
If you survey a major urban area that has lots of office workers on the topic of remote work, you shift the denominator and reveal much higher rates of remote work. For example, a May 2022 survey of NYC employers found that just 8% of workers were expected to be in the office five days a week on a go-forward basis. At Stuga, we surveyed high-income knowledge workers across a dozen major metros (NYC, LA, CHI, DC, SF, etc.) and found that 67% of respondents had at least some degree of remote or flexible work.
So how many jobs will be done remotely? If I were to make a prediction about the long-term future of remote work, it would look like this: about 40% of all jobs are done remotely either fully or partially. Half of those jobs, or 20% of total jobs, are done fully remotely. And the other half, or another 20% of total jobs, are done partially remotely (e.g., three days on average in an office, two days on average from home). And the 40% of jobs done partially or fully remotely are mostly held by educated, higher-income knowledge workers.
Understanding the behavior of these workers, and their employers, in a new era of remote work is the key to understanding the impact on real estate markets and US economic geography and is covered in Part 3.


